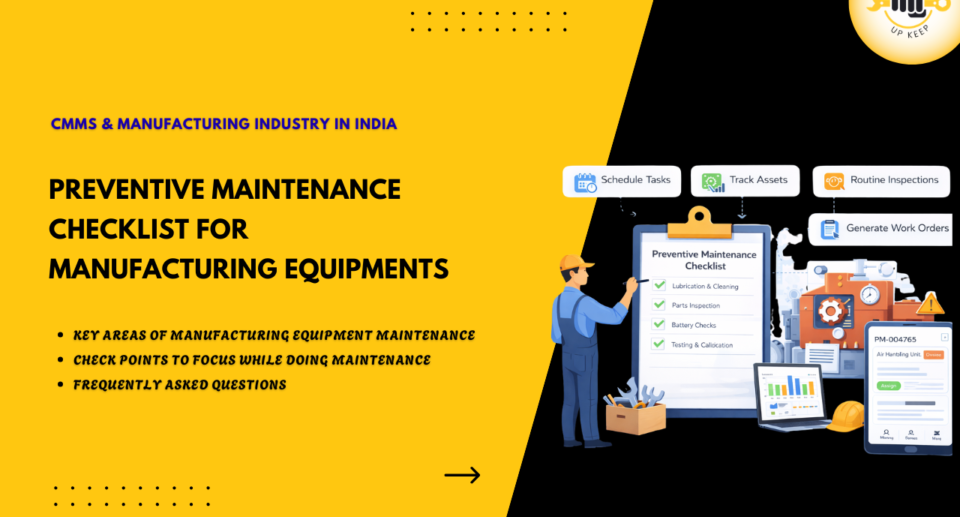
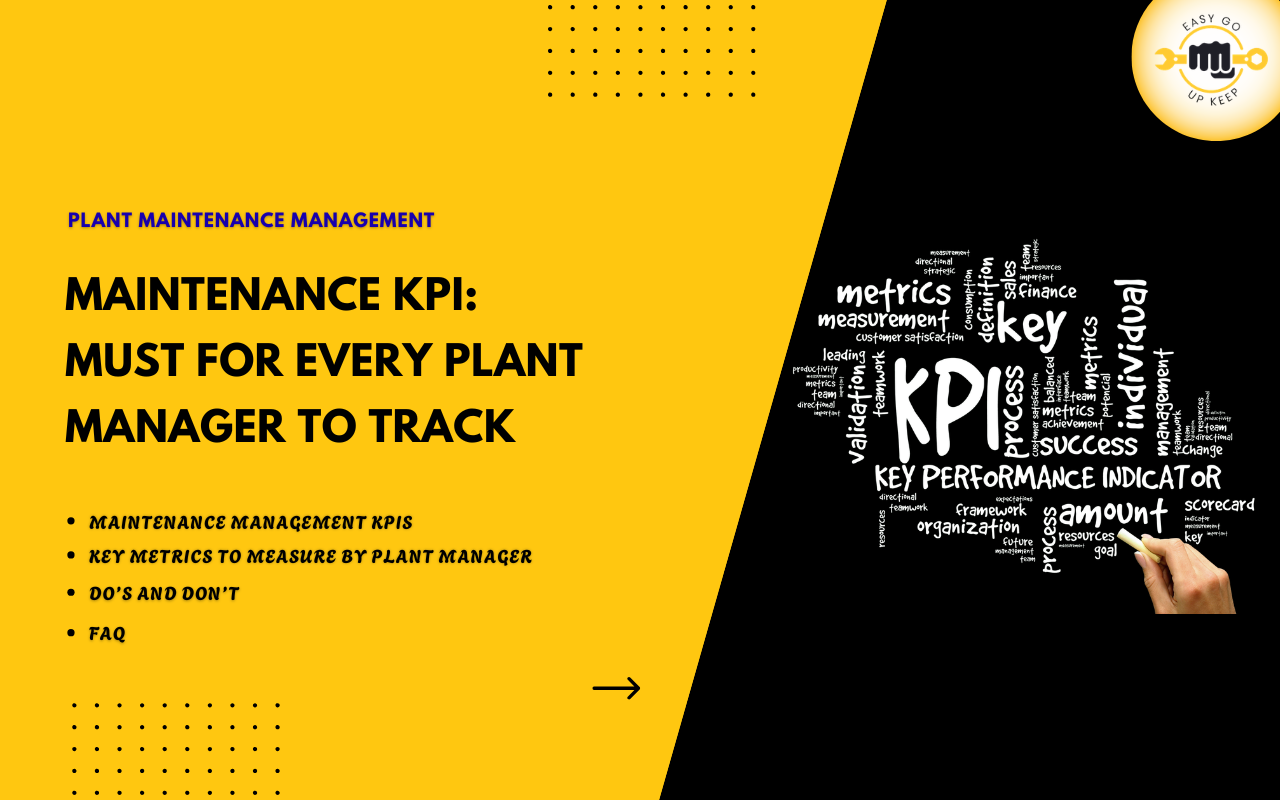
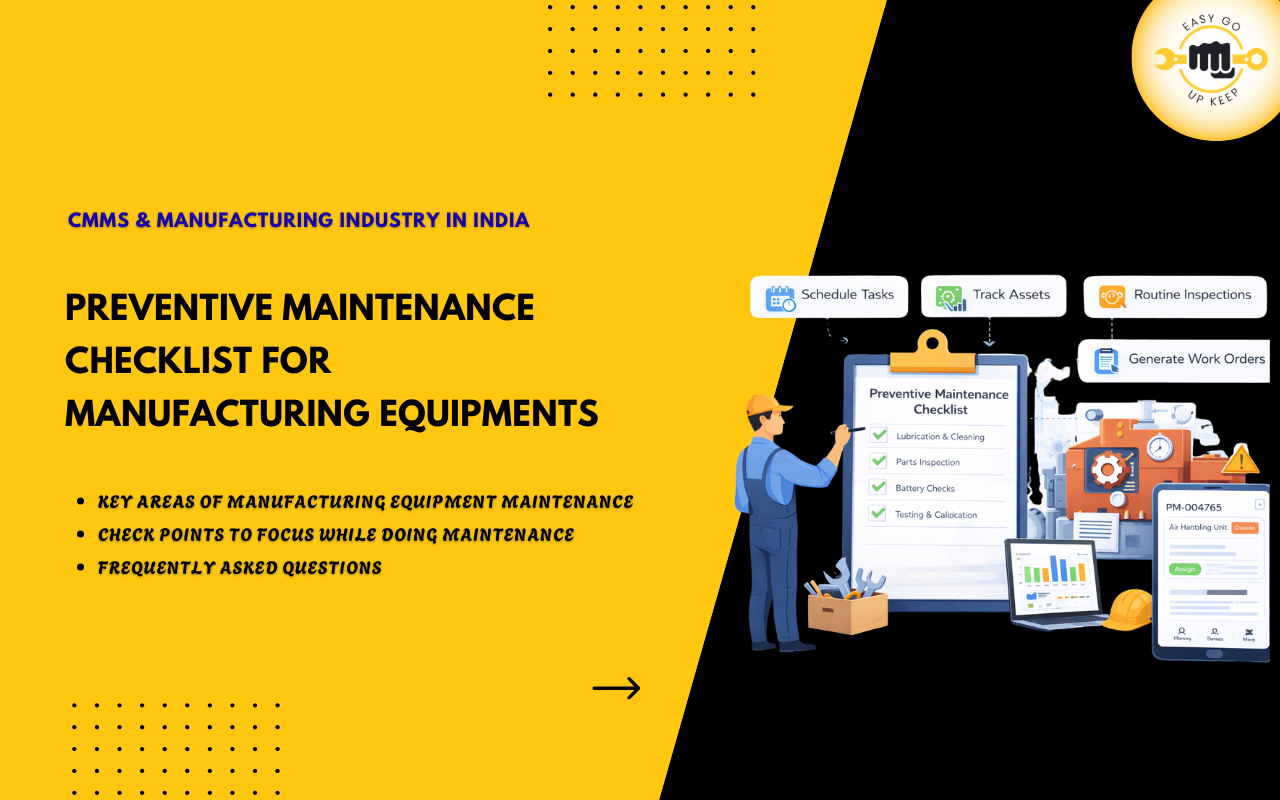
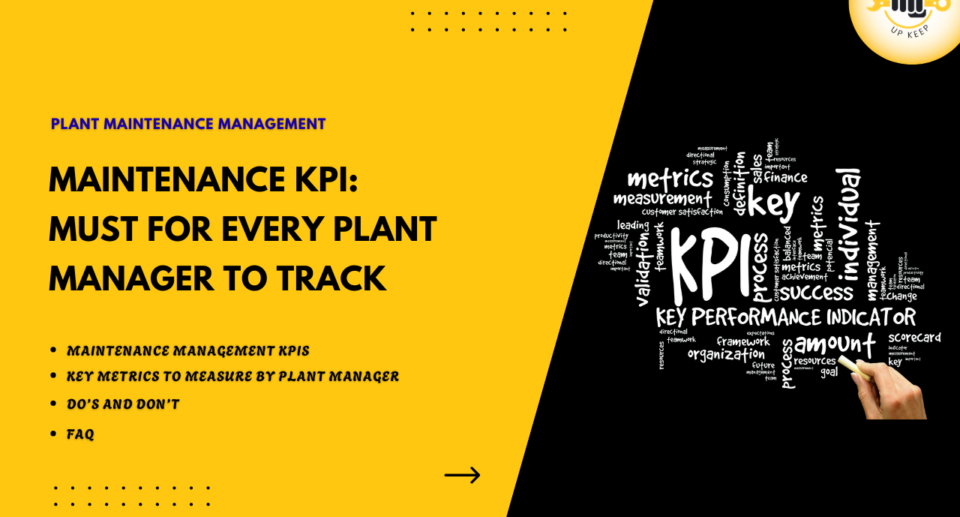
Maintenance KPIs Every Plant Manager Should Track
Manufacturing plants operate with complex equipment, tight production schedules, and high expectations for operational reliability. When machines stop unexpectedly, the consequences can include production loss, delayed deliveries, and increased operational costs. To monitor maintenance performance and equipment reliability effectively, plant managers rely on measurable indicators known as maintenance KPIs.
Maintenance KPIs provide a structured way to evaluate how well maintenance activities support production operations. By tracking the right indicators, plant managers can identify performance gaps, improve preventive maintenance planning, and ensure that equipment remains available for production. Instead of relying on assumptions or reactive troubleshooting, KPI-based monitoring allows maintenance teams to make informed operational decisions.
What are maintenance KPIs?
Maintenance KPIs are measurable indicators used to evaluate the effectiveness and efficiency of maintenance activities within a manufacturing facility. These indicators help organizations monitor equipment performance, maintenance productivity, downtime trends, and maintenance costs.
In manufacturing environments, maintenance operations involve multiple activities such as preventive maintenance, breakdown repairs, spare parts management, and technician coordination. Without proper performance indicators, it becomes difficult to evaluate whether these activities are improving equipment reliability or simply reacting to problems.
By monitoring maintenance KPIs regularly, plant managers gain visibility into equipment health, maintenance workload distribution, and operational efficiency. These insights help maintenance teams improve planning, reduce unplanned downtime, and maintain stable production operations.
Key maintenance KPIs every plant manager should track
Manufacturing plants generate large volumes of operational data, but only a few indicators truly reflect maintenance performance. The following maintenance KPIs provide essential insights into equipment reliability, maintenance efficiency, and overall plant performance.
Mean Time Between Failures (MTBF)
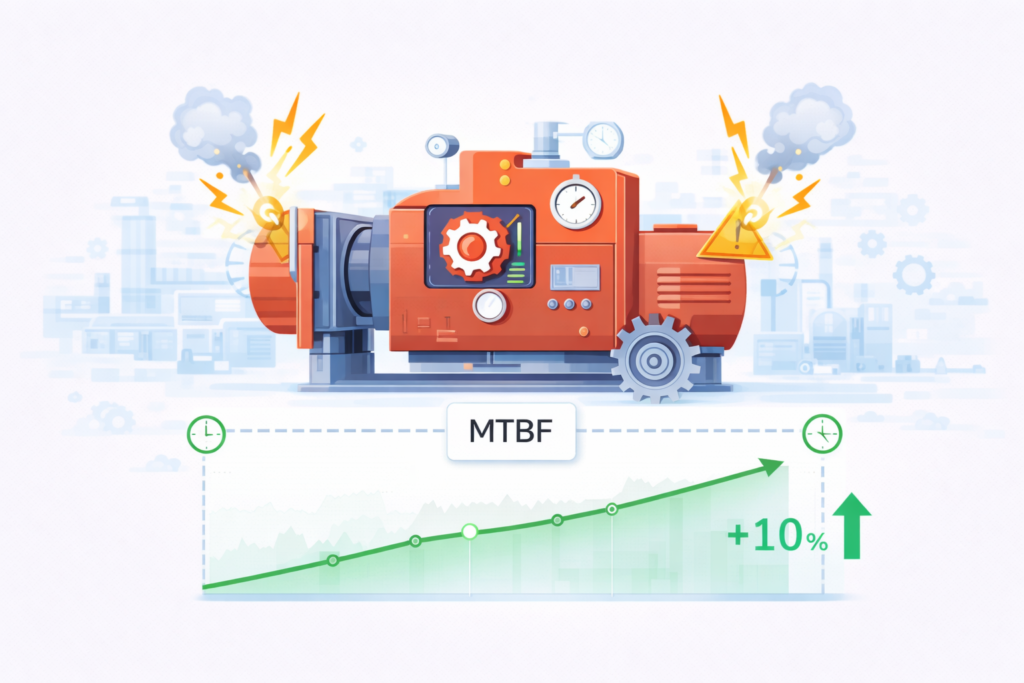
Mean Time Between Failures measures the average operating time of equipment between two consecutive failures. It is one of the most important indicators used to evaluate equipment reliability.
Formula:
MTBF = Total operating time ÷ Number of failures
For example, if a machine operates for 1,000 hours and experiences four failures during that period, the MTBF would be 250 hours. A higher MTBF indicates that equipment operates longer before experiencing a breakdown.
Tracking MTBF helps maintenance teams identify machines that frequently fail and require closer monitoring or improved preventive maintenance practices.
Mean Time to Repair (MTTR)
Mean Time to Repair measures the average time required to repair equipment after a failure occurs. This KPI reflects how efficiently maintenance teams diagnose and resolve equipment problems.
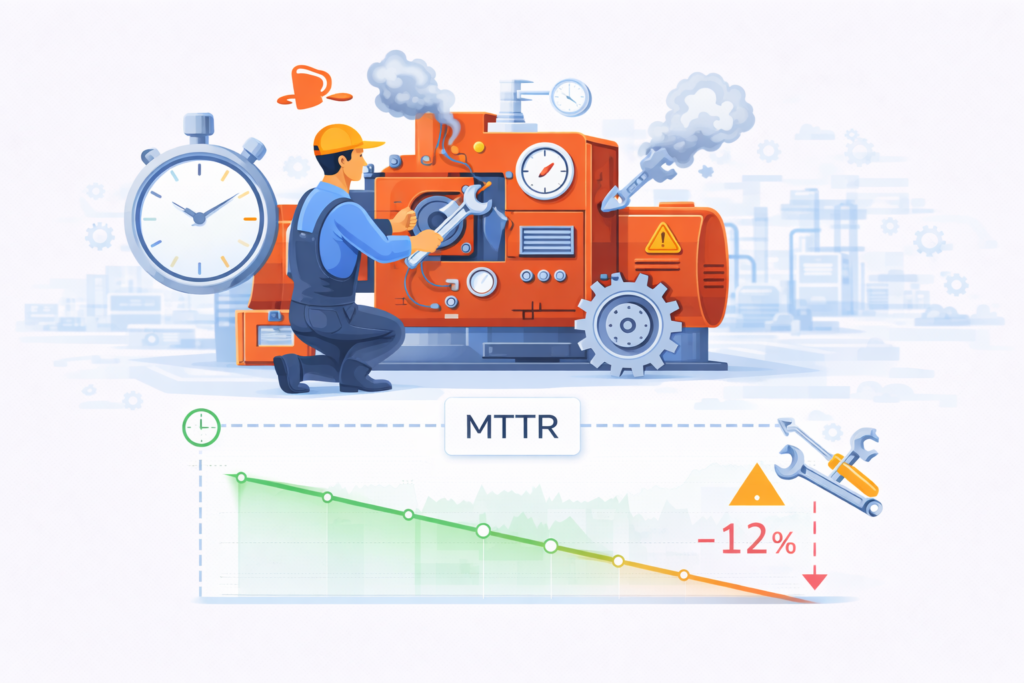
Formula:
MTTR = Total repair time ÷ Number of repairs
A lower MTTR indicates faster repair processes and quicker restoration of equipment operation. Efficient spare parts availability, well-trained technicians, and clear troubleshooting procedures all contribute to reducing MTTR.
Monitoring MTTR helps plant managers evaluate maintenance team efficiency and identify opportunities to streamline repair processes.
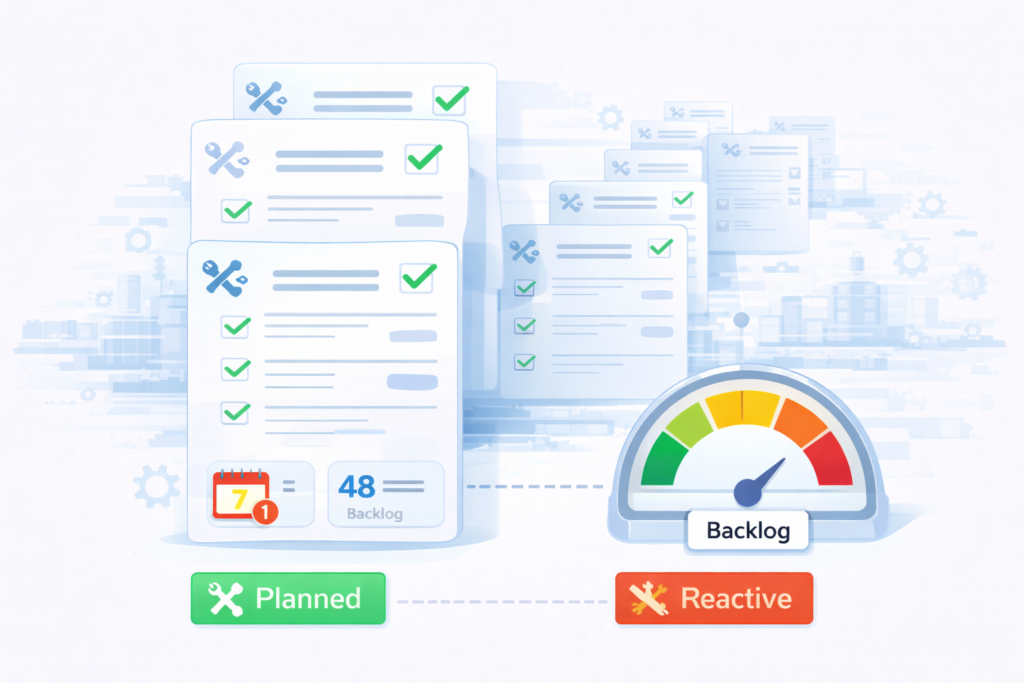
Planned vs Unplanned Maintenance Ratio
This KPI compares the amount of maintenance work that is planned in advance versus work that occurs due to unexpected equipment failures.
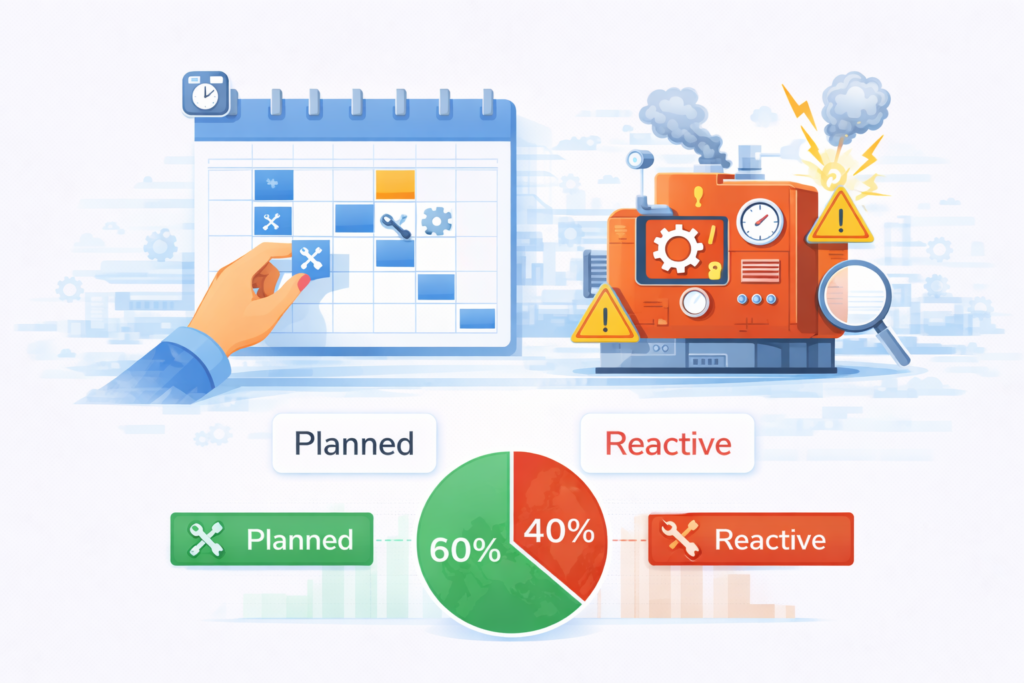
Planned maintenance includes activities such as preventive maintenance inspections, lubrication tasks, and scheduled component replacements. Unplanned maintenance usually involves emergency repairs following equipment breakdown.
A healthy maintenance environment typically has a higher percentage of planned maintenance activities. When unplanned maintenance dominates, it often indicates that preventive maintenance programs are ineffective or inconsistently followed.
Tracking this KPI helps plant managers understand the maturity level of their maintenance strategy.
Preventive Maintenance Compliance
Preventive maintenance compliance measures the percentage of scheduled preventive maintenance tasks completed within the planned time frame.
For example, if 100 preventive maintenance tasks are scheduled in a month and 90 are completed as planned, the compliance rate would be 90 percent.
Low compliance levels usually indicate scheduling issues, manpower shortages, or poor maintenance planning. Over time, missed preventive maintenance activities can lead to increased equipment failures.
Maintaining high preventive maintenance compliance helps ensure that machines receive timely inspections and servicing.
Maintenance Cost per Asset
Maintenance cost per asset measures the total maintenance expenditure associated with a specific piece of equipment or asset group. This includes labor costs, spare parts consumption, and external service expenses.
Tracking maintenance cost per asset allows plant managers to identify machines that require excessive maintenance spending. In some cases, high maintenance costs may indicate that equipment is approaching the end of its useful life.
By analyzing this KPI, organizations can make informed decisions regarding equipment upgrades, refurbishment, or replacement.
Equipment Availability
Equipment availability measures the percentage of time that machines are available and ready for production. It reflects how effectively maintenance activities support continuous plant operations.
Formula:
Equipment Availability = (Operating Time ÷ Total Planned Production Time) × 100
When equipment availability is low, production schedules become difficult to maintain. Frequent breakdowns, long repair times, or delayed maintenance activities can all reduce availability.
Monitoring this KPI helps plant managers identify bottleneck machines that impact production efficiency.
How plant managers can use maintenance KPIs effectively
Collecting maintenance data alone does not improve performance. Plant managers must analyze KPI trends regularly and use them to guide operational decisions.
For example, a declining MTBF trend may indicate recurring equipment failures that require root cause analysis. High MTTR values may suggest delays in spare parts availability or inefficient troubleshooting procedures.
Similarly, a low preventive maintenance compliance rate may indicate that maintenance schedules are unrealistic or that technicians are overloaded with reactive repair work.
By reviewing maintenance KPIs consistently, plant managers can identify operational weaknesses and take corrective actions before they affect production performance.
Role of maintenance management software in KPI tracking
In many manufacturing plants, maintenance data is often scattered across manual logbooks, spreadsheets, and departmental records, making it difficult to monitor performance indicators consistently. Maintenance management software for Indian maintenance teams centralizes asset data, work orders, inspection records, and maintenance history into a single system. This allows plant managers to track maintenance KPIs more accurately and analyze performance trends that support better maintenance planning and operational decisions.
- Automated data capture
Maintenance software records work orders, inspection results, and repair activities automatically, ensuring accurate and consistent data collection for KPI tracking. - Equipment performance monitoring
The system tracks asset history and failure records, allowing plant managers to analyze equipment reliability and identify machines that frequently experience breakdowns. - Real-time KPI dashboards
Digital dashboards display important maintenance KPIs such as MTBF, MTTR, and equipment availability, helping managers quickly evaluate maintenance performance. - Preventive maintenance tracking
The software monitors preventive maintenance schedules and completion rates, allowing teams to measure preventive maintenance compliance accurately. - Maintenance cost analysis
By linking spare parts usage and labor costs to specific assets, maintenance systems help calculate maintenance cost per asset and identify high-cost equipment. - Failure trend analysis
Historical maintenance data helps identify recurring equipment failures and supports root cause analysis to improve long-term reliability. - Work order performance monitoring
Maintenance systems track work order completion time and technician productivity, allowing better evaluation of maintenance team efficiency. - Improved maintenance planning
KPI insights generated from maintenance software help maintenance managers optimize scheduling, prioritize critical equipment, and improve maintenance strategies. - Centralized reporting and documentation
Maintenance data stored in a centralized system simplifies reporting and allows plant managers to review performance trends over time.
Conclusion
Maintenance KPIs provide plant managers with measurable insights into equipment reliability, maintenance efficiency, and operational performance. By monitoring indicators such as MTBF, MTTR, preventive maintenance compliance, and equipment availability, organizations can identify weaknesses in their maintenance processes and improve operational stability.
When maintenance teams consistently track these indicators and use the data to refine maintenance planning, manufacturing plants can reduce equipment failures, improve machine availability, and maintain more reliable production operations.